BETI increased somewhat in April signalling resilience amid a challenging economic environment
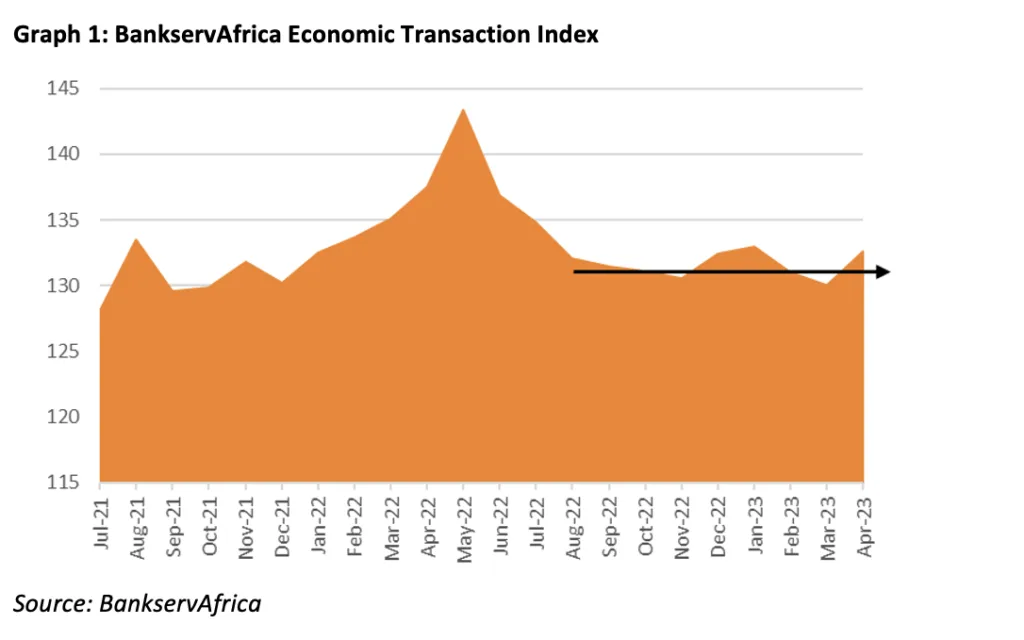
After two consecutive monthly declines, the BankservAfrica Economic Transactions Index (BETI) increased in April 2023 to an index level of 132.6, tracing back to the January 2023 level (132.9), but still notably lower than a year earlier. On an annual basis, the BETI declined by 3.5% vs a revised decline of 3.8% in March. While

BETI increased somewhat in April signalling resilience amid a challenging economic environment

After two consecutive monthly declines, the BankservAfrica Economic Transactions Index (BETI) increased in April 2023 to an index level of 132.6, tracing back to the January 2023 level (132.9), but still notably lower than a year earlier. On an annual basis, the BETI declined by 3.5% vs a revised decline of 3.8% in March. While a monthly increase was recorded, the BETI still fell on an annual and quarterly basis, signalling that the improvement is a small blip and unlikely to be the start of a notable recovery phase for the economy. In actual fact, the BETI moved mostly sideways in the past nine months, with some volatility from month to month – see graph 1.
The slight improvement in the BETI occurred against the broader economic context that has remained fairly grim during April, with load shedding continuing unabatedly, interest rates and inflation remaining at elevated levels and the global economic slowdown still prevalent. This indeed points to the resilience of the South African economy, despite ongoing challenges.
The general sideways movement in the BETI confirms that the economy remains in a ‘muddle-along-little-thriving’ narrative. This is also the story of many other nowcast indicators. After having moved sideways in December 2022 (53.1) and January 2023 (53.0), the Absa Purchasing Managers’ Index (PMI), plummeted to 48.8 index points in February, and further to only 48.1 in March, before recovering to 49.8 in April. After a solid start to the year, April was the third straight month that the index pointed to a deterioration in business conditions in the manufacturing sector. The S&P Global South Africa Purchasing Managers Index (PMI) also signalled dismal economic activity in the private sector, dropping from 50.5 in February to 49.7 in March and further to 49.6 in April, remaining below the 50.0 neutral mark, suggesting contraction. The report noted that business activity at South African firms continued to contract at the start of the second quarter, as a slight uplift in demand was more than offset by capacity constraints from load shedding and supply shortages. Even the resilient vehicle market faltered since March. The motor industry sold 37 107 cars and commercial vehicles in April — 0.2% fewer than in the corresponding month of 2022. Passenger car sales took the biggest knock, dropping 6.0% y/y from 31 631 to 24 174 in April 2023.
On the global front, April saw a further marginal increase in global manufacturing production, as improved supply-chain conditions and the clearance of existing backlogs offset weaker demand. The J.P.Morgan Global Manufacturing PMI™ – a composite index produced by J.P.Morgan and S&P Global in association with ISM and IFPSM – however remained unchanged at 49.6 in April, the eighth successive month below the neutral 50.0 mark, signalling ongoing strain in the global manufacturing sector. However, the broader J.P.Morgan Global Composite Output Index – produced by J.P.Morgan and S&P Global in association with ISM and IFPSM – rose to 54.2 in April, up from 53.4 in March, with the headline index remaining above the neutral 50.0 mark and signalling expansion in each of the past three months. So clearly not a synchronised global recovery across all sectors, though pockets of growth are evident.
The BETI and other indicators suggest that economic growth stagnated in Q1. The BETI already flagged the potential of a negative quarterly growth rate in Q1 2023, with the March BETI 1.9% lower than in the quarter ending December 2022. While the BETI had a small increase in April, the other nowcast indicators confirm our reservations that it is likely to be the start of a notable recovery phase for the economy. Rather, South Africans should prepare themselves for ‘more of the same’ for a longer period than hoped for.
Number of transactions declined in April 2023
The standardised nominal value of transactions that cleared through BankservAfrica in April 2023 was R1.22 trillion vs. March’s R1.19 trillion, while the number of transactions moderated from an all-time high of 149 million in March to 135.9 million in April 2023, partially explained by the many public holidays in April. An interesting observation (based on the raw data from BankservAfrica), is that the average value of transactions covered by the BETI declined over time, especially in the last six months. The average value of an electronic transaction was R7718 in April 2023, 6.4% lower than the average recorded a year earlier. This probably confirms the growing trend in electronic payments as the economy migrates, slowly, to digital payments and users opt for electronic payments, even for smaller amounts, compared to the past.
Graph 2: Average transaction value for BETI transactions in rand
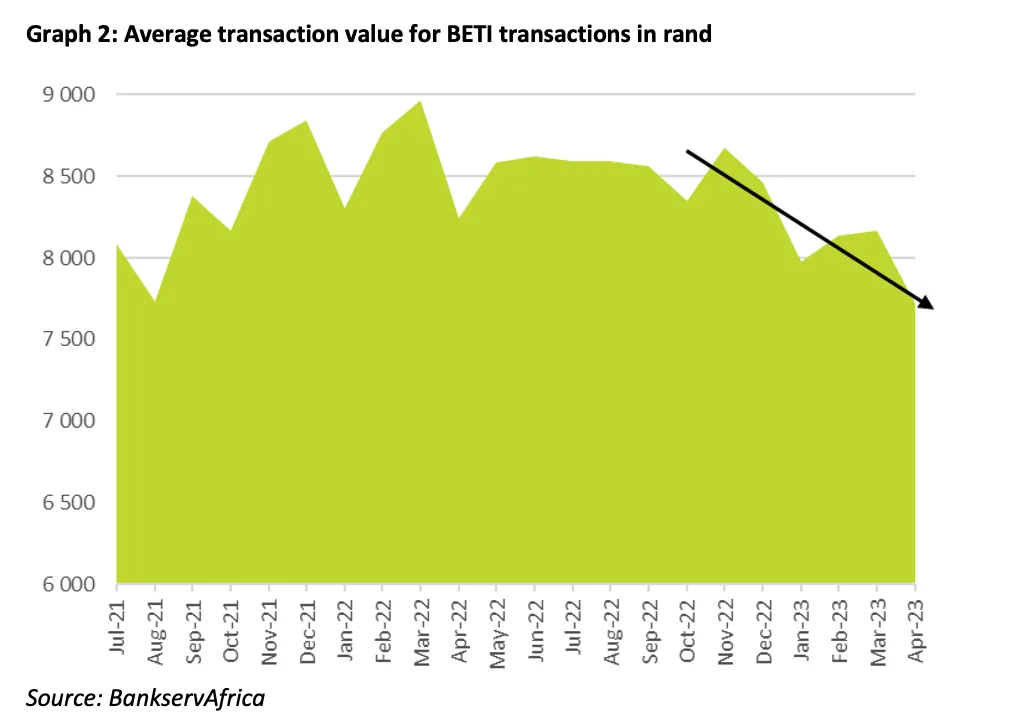
Table 1: The BankservAfrica Economic Transaction Index
| The BETI Index | The headline BETI % change | BETI quarterly % change* | BETI monthly % change | |
| Jul-21 | 128.0 | 15.0% | -2.4% | -1.8% |
| Aug-21 | 133.5 | 13.5% | 2.0% | 4.3% |
| Sep-21 | 129.5 | 6.7% | -0.6% | -3.0% |
| Oct-21 | 129.9 | 4.7% | 1.4% | 0.3% |
| Nov-21 | 131.8 | 6.2% | -1.3% | 1.5% |
| Dec-21 | 130.2 | 4.2% | 0.5% | -1.2% |
| Jan-22 | 132.5 | 6.7% | 2.0% | 1.8% |
| Feb-22 | 133.7 | 6.1% | 1.4% | 0.9% |
| Mar-22 | 135.1 | 5.8% | 3.8% | 1.1% |
| Apr-22 | 137.5 | 4.9% | 3.8% | 1.8% |
| May-22 | 143.3 | 9.4% | 7.2% | 4.2% |
| Jun-22 | 136.9 | 5.0% | 1.3% | -4.5% |
| Jul-22 | 134.8 | 5.3% | -2.0% | -1.5% |
| Aug-22 | 132.1 | -1.1% | -7.8% | -2.0% |
| Sep-22 | 131.4 | 1.5% | -4.0% | -0.5% |
| Oct-22 | 131.1 | 1.0% | -2.7% | -0.2% |
| Nov-22 | 130.6 | -0.9% | -1.2% | -0.4% |
| Dec-22 | 132.5 | 1.7% | 0.8% | 1.4% |
| Jan-23 | 132.9 | 0.3% | 1.4% | 0.4% |
| Feb-23 | 131.0 | -2.0% | 0.3% | -1.5% |
| Mar-23 | 130.0 | -3.8% | -1.9% | -0.7% |
| Apr-23 | 132.6 | -3.5% | -0.2% | 2.0% |
Source: BankservAfrica and Carpe Diem Research
* Quarterly change in the BETI is calculated by comparing the last month of the quarter to the preceding quarter’s last month e.g. Sep 22 vs June 22
Table 2: The volume and average value of transactions and the standardised BETI in nominal terms
| Nominal standardised value of transactions | Number of transactions | Change in Transaction Volume y/y | Average Transaction Value | |
| Jul-21 | 971 405 321 598 | 122 534 840 | 14.3% | 8083 |
| Aug-21 | 1 079 970 334 333 | 139 115 440 | 34.3% | 7738 |
| Sep-21 | 1 016 856 555 771 | 122 463 947 | 16.0% | 8379 |
| Oct-21 | 1 036 674 654 205 | 126 082 582 | 11.1% | 8171 |
| Nov-21 | 1 129 846 454 138 | 127 206 375 | 20.6% | 8715 |
| Dec-21 | 1 147 364 076 089 | 128 960 377 | 9.6% | 8842 |
| Jan-22 | 960 782 863 732 | 114 988 683 | 16.1% | 8304 |
| Feb-22 | 1 122 350 186 710 | 118 715 952 | 12.7% | 8765 |
| Mar-22 | 1 150 548 182 261 | 131 212 659 | 8.4% | 8965 |
| Apr-22 | 1 168 029 601 917 | 126 214 672 | 9.8% | 8246 |
| May-22 | 1 229 315 269 279 | 127 591 161 | 11.1% | 8585 |
| Jun-22 | 1 121 151 326 630 | 127 572 169 | 10.0% | 8623 |
| Jul-22 | 1 127 335 386 315 | 130 429 591 | 6.4% | 8590 |
| Aug-22 | 1 144 019 181 627 | 136 146 702 | -2.1% | 8591 |
| Sep-22 | 1 156 444 235 655 | 136 249 384 | 11.3% | 8565 |
| Oct-22 | 1 160 148 154 981 | 138 022 680 | 9.5% | 8353 |
| Nov-22 | 1 202 776 795 372 | 139 826 464 | 9.9% | 8680 |
| Dec-22 | 1 302 643 668 412 | 143 643 691 | 11.4% | 8464 |
| Jan-23 | 1 043 515 523 493 | 129 990 886 | 13.0% | 7978 |
| Feb-23 | 1 167 553 812 137 | 132 983 149 | 12.0% | 8139 |
| Mar-23 | 1 190 950 905 193 | 149 011 722 | 13.6% | 8171 |
| Apr-23 | 1 221 443 995 980 | 135 864 045 | 7.6% | 7718 |
Source: BankservAfrica and Carpe Diem Research