Load-shedding in 2021 — according to EskomSePush
South Africa’s most popular load-shedding app, EskomSePush (ESP), has built up a large cache of information about the country’s loathed rotational power cuts during 2021. ESP co-founder Herman Maritz recently announced he would be working on the app and related projects full-time for the next six months. Although he could not share more about their
Load-shedding in 2021 — according to EskomSePush
South Africa’s most popular load-shedding app, EskomSePush (ESP), has built up a large cache of information about the country’s loathed rotational power cuts during 2021.
ESP co-founder Herman Maritz recently announced he would be working on the app and related projects full-time for the next six months.
Although he could not share more about their plans for ESP, Maritz divulged some interesting details around the prevalence of load-shedding tracked by the app.
Notably, ESP’s measurement for how bad load-shedding was differs from the approach taken by the Council for Scientific Research (CSIR).
According to the CSIR, load-shedding was at its worst in 2021, with higher stages of load-shedding being required more frequently.
Its analysis is based on the overall electricity shed from the grid during periods of load-shedding in 2021.
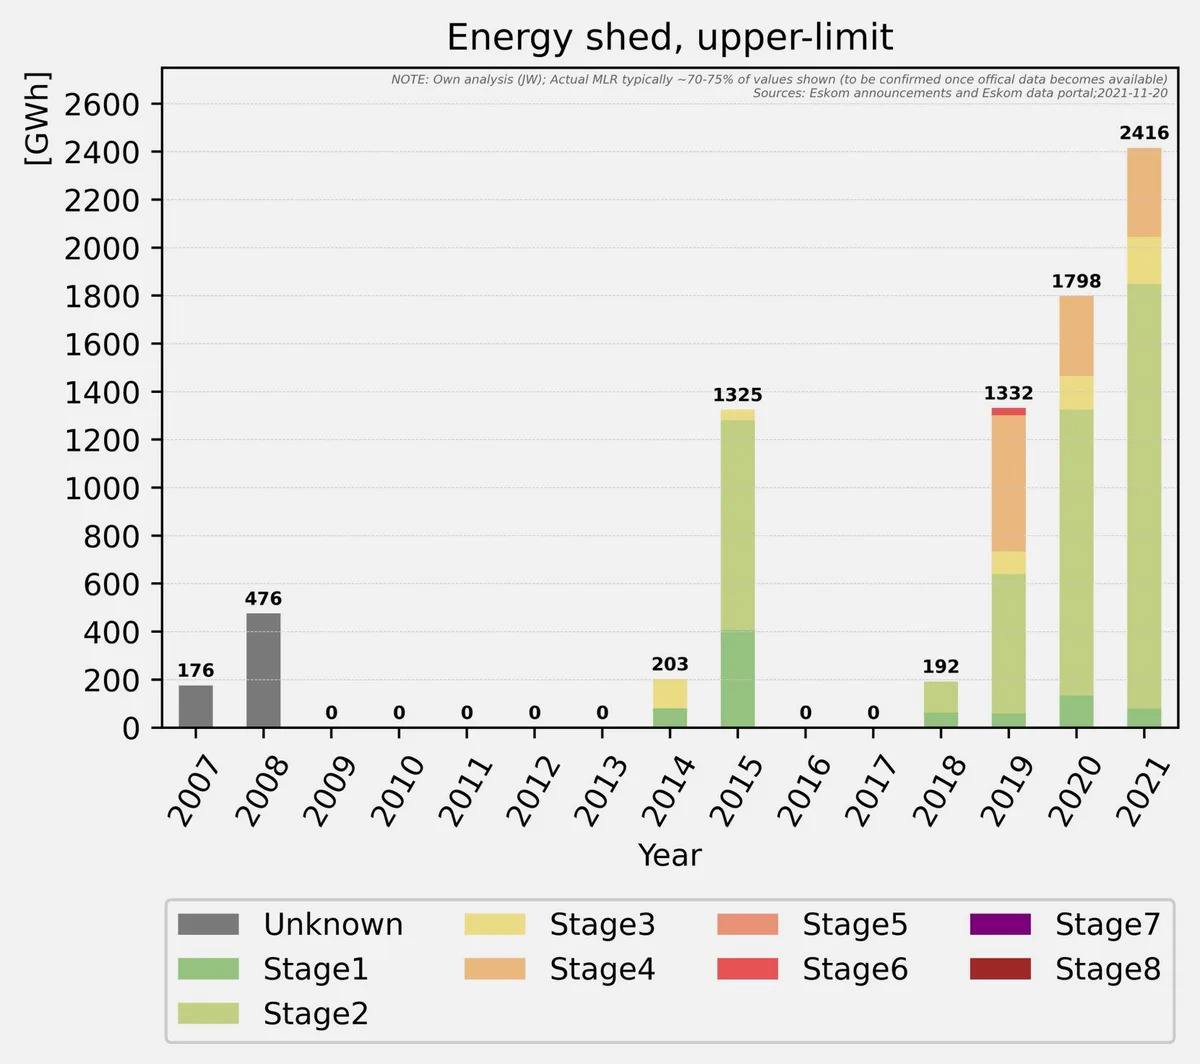
In 2021, the CSIR found that Eskom had shed 2,416GWh — the highest amount ever — resulting in the worst load-shedding for any year to date.
Based on this analysis, the second-worst year was 2020, when Eskom shed 1,798GWh, while 2019 ranked third-worst with 1,332GWh.
The chart below, courtesy of CSIR researcher Jarrad Wright, provides an overview of the amount of electricity shed through load-shedding since 2007.
ESP’s data tracks the number of hours load-shedding was in effect, providing a cumulative figure of the total time there had been load-shedding anywhere in the country.
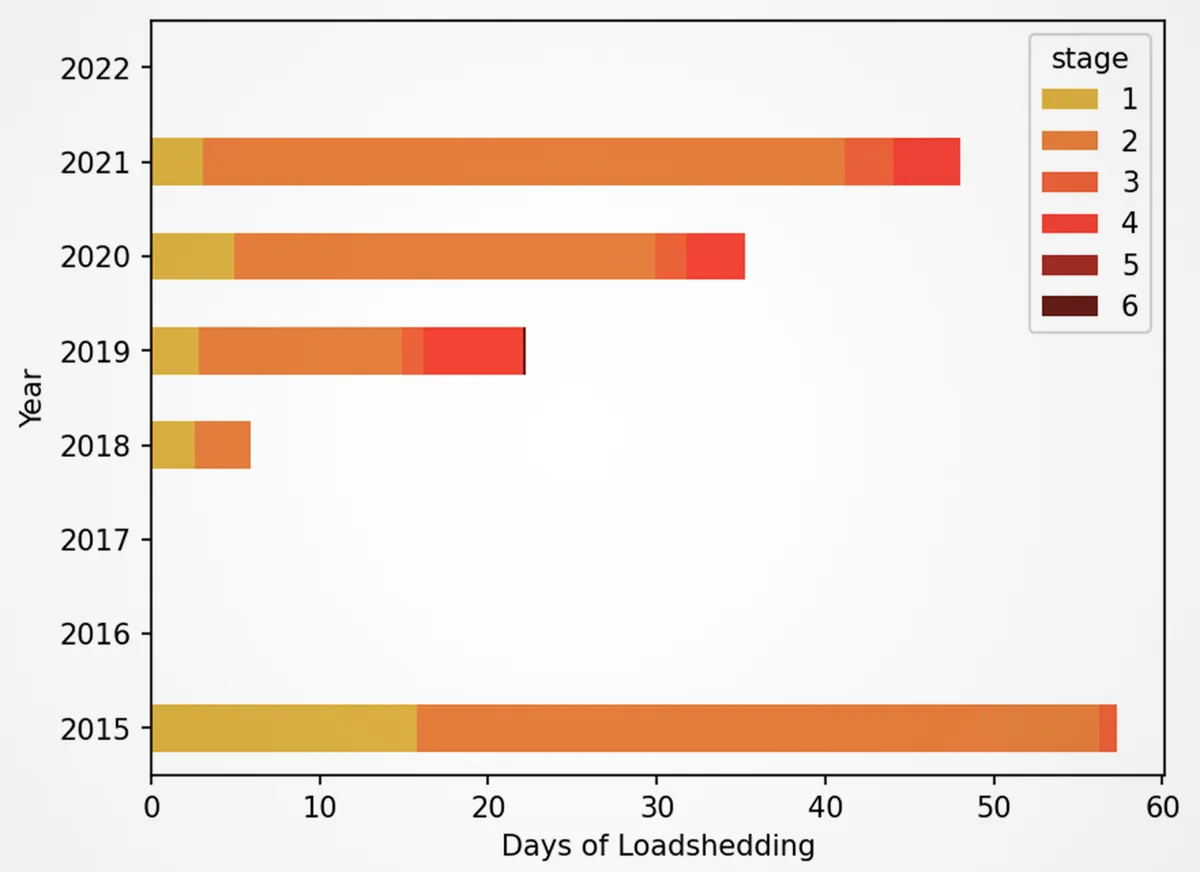
This analysis showed South Africa had 48 days of load-shedding in 2021. By comparison, 2015 had 57 days of load-shedding.
The graph and table below show how many days load-shedding was in effect between 2015 and 2021 and compares the frequency of various load-shedding stages based on ESP’s data.
According to ESP, Stage 2 was the most common stage implemented in 2021, accounting for 82% of the total load-shedding time.
The longest period of continuous load-shedding was eight days between 10 March and 18 March 2021.
That bout was due to continued poor performance at Eskom’s Kusile, Duvha, and Tutuka power stations, alongside delays in returning other units to service.
Main Image; Stuff